English / Japanese
M-Logger, the Thermal Environment Measurement System
This is the support site for the M-Logger system, developed to measure the building thermal environment. M-Logger system has the following features.
- All specifications and technical documents are freely available on the web (open-source hardware).
- Compact size of 64×40×30 mm.
- Capable of measuring dry-bulb temperature, relative humidity, globe temperature, and low air velocity necessary for evaluating thermal comfort.
- Can calculate and display thermal comfort indices (PMV, PPD, SET*) in real-time.
- Measures illuminance to infer room conditions.
- Runs on two AA batteries (no need for a power outlet).
- Can perform continuous measurements for several weeks on batteries.
- The cost per unit is less than $100.
- Initial setup and data collection can be done wirelessly.
- Compatible with Windows, Mac, and Linux.
- Can also be used with a smartphone (iPhone, Android).
Information for Users
- How to purchase
Available on Amazon.
https://www.amazon.com/dp/B0C7GJ7KW5
- How to use from a smartphone
With an iPhone or Android, you can use M-Logger instantly.
Please read Chapter 3 of the document for more information.
- How to use from a PC
Multiple M-Loggers can be connected to a PC to simultaneously display and save measurements.
Please read Chapter 4 of the document for more information.
Information for Developers
- Git repository
Since M-Logger is open-source hardware, the following information required for its manufacturing is available on GitHub.
- Board design (EAGLE data)
- BOM (Bill of material)
- Project files for programs to be written to M-Logger's microcontroller (Microchip Studio for AVR)
- 3D model data for manufacturing instrument case (Rhinoceros data)
- Project file for the software to use the M-Logger from a smartphone and PC (Visual Studio data)
- Related paper
This paper reports on the principle of velocity measurement of the M-Logger, the magnitude of error, and the continuous operation time with batteries.
Others
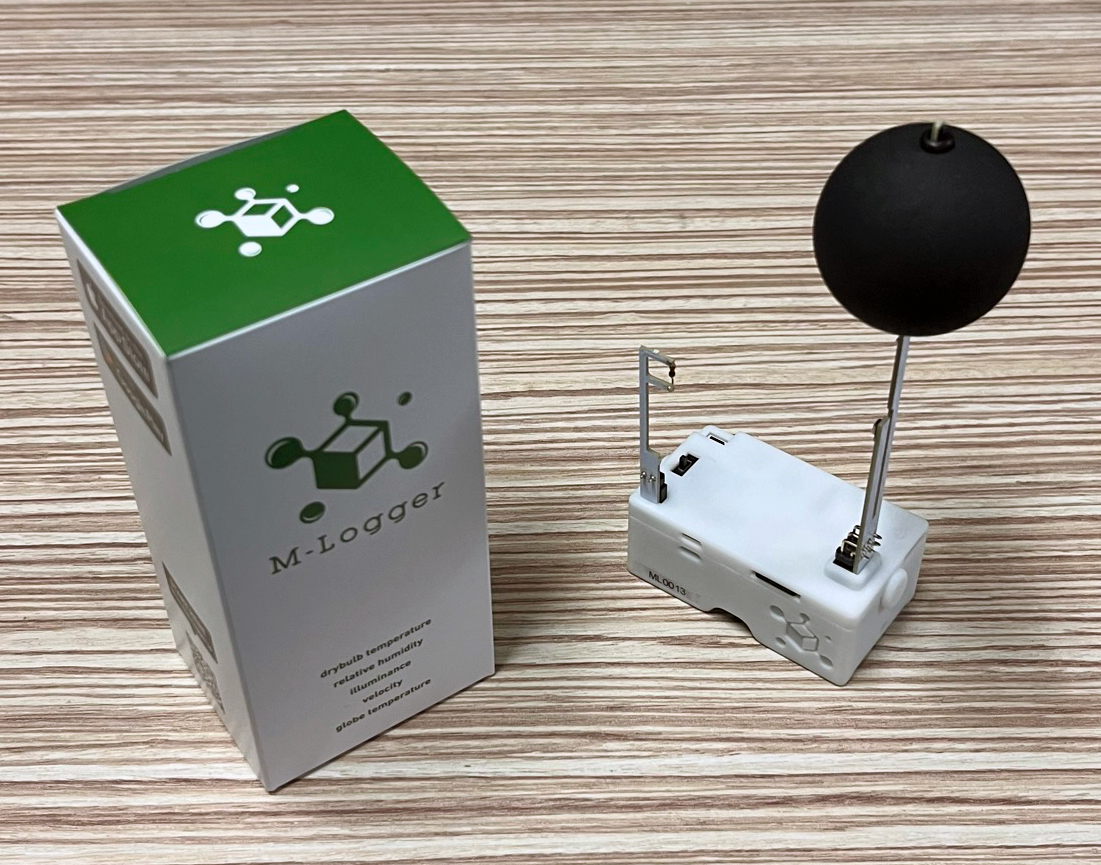
- Appearnace of the M-Logger
- Example of visualization of measurement results
This is an example where 85 devices were installed in a floor air-conditioning laboratory to measure the thermal environment spatially at 3-second intervals.
The size of the spheres represents velocity, and the color represents dry-bulb temperature.
The visualization effectively shows cold air being blown from the floor and being sucked in through the central ceiling intake.